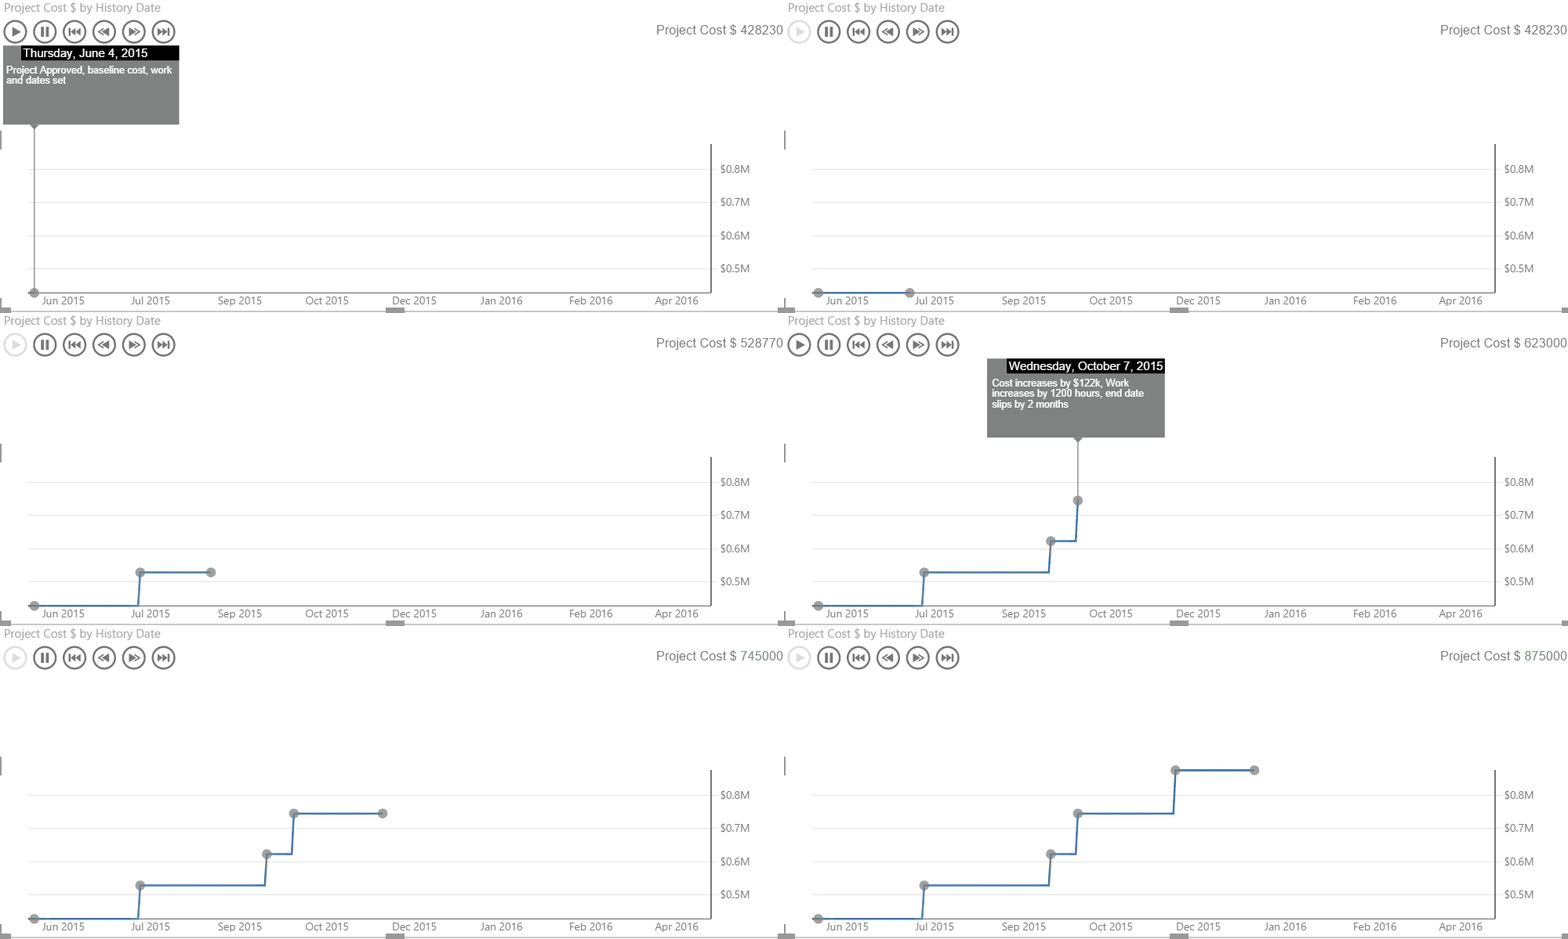
The new Power BI Pulse Chart is perfect for illustrating project trends. Each “pulse” can display a call-out with details of changes in the project plan. See below for a good example, and go to ShareAdvance to see a live version of this report, and learn how to capture project trend data and create a Power BI Pulse Chart for your projects!
Power BI Pulse Chart for Project Trends


